
With all eyes and ears on this week’s Fed meeting, it’s worth taking a big step back to reflect on conditions related to momentum, breadth, and leadership. And while the rally of the early April lows has been significant, the S&P 500 and Nasdaq 100 now face considerable resistance at the 200-day moving average.
With that backdrop in mind, here are three charts we’re watching that have not yet signalled an “all clear” for risk assets.
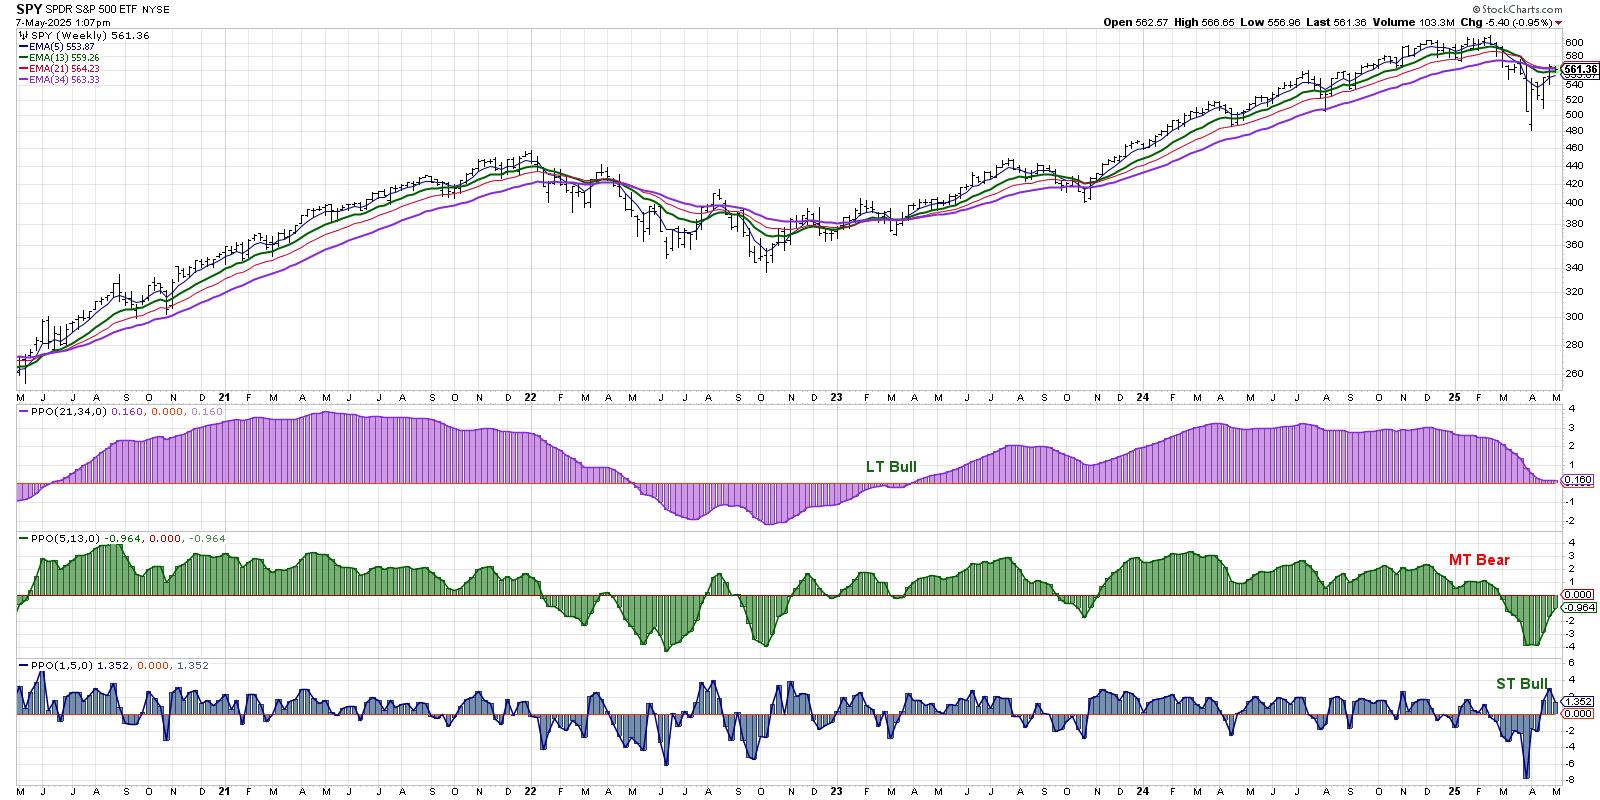
Our Market Trend Model Remains Medium-Term Bearish
Long-time market newsletter author Paul Montgomery used to point out that the most bullish thing the market can do is go up. The way we make this simple assessment of market trend is using our Market Trend Model.
As of last Friday’s close, our Market Trend Model shows a short-term bullish signal given the strength off the early April low. The medium-term model, however, remains bearish as the recent bounce is still defined as a bear market rally. If the S&P 500 can push above its own 200-day moving average, that would likely be enough to move the medium-term model to the bullish side for the first time since October 2023.
Over the years, I’ve found the Market Trend Model to be a fantastic way of separating the short-term “flickering ticks” of day-to-day market movements from the more significant shifts in sentiment from bullish to bearish. And by staying on the right side of this model, I’ve been able to capture most of the market upside, and more importantly, avoid disastrous bear phases!
Don’t miss our daily market recap show, CHART THIS with David Keller, CMT. We’ll track how these charts evolve through the course of the week, highlight key stocks on the move, and boil down the most important market themes from a technical perspective. Join us live every trading day at 5pm ET, or catch the replay on our YouTube channel!
Will Key Stocks Breakout Above the 200-Day?
While the S&P 500 and Nasdaq 100 are testing their own 200-day moving averages, many S&P 500 members are in a very similar position. At the April 2025 market low, less than 10% of the S&P 500 stocks were above their 50-day moving average. That reading has reached almost 60% this week as literally half of the S&P 500 members have regained this short-term moving average.
While the bottom panel shows the percent of stocks above the 50-day moving average, the next panel up displays the percent of S&P 500 members above their 200-day moving average. While this has also increased over the last month, it still remains below 50%.
The countertrend rally in March 2025 saw this indicator go up to the 50% and then reverse lower, providing a warning sign of further lows to come. Will we see a similar stall in this indicator in May 2025? If so, that could indicate a retest of the April low. On the other hand, if both of these gauges push above 50%, then investors should brace for much further upside for the S&P 500.
Offense Needs to Dominate Defense
Leadership themes could become incredibly important, as many leading growth stocks remain in a position of technical weakness. And unless the top growth stocks go into full rally mode, it’s hard to imagine meaningful upside for the S&P 500 and Nasdaq 100. One way to consider this relationship is to chart the ratio between Consumer Discretionary and Consumer Staples.
The top panel shows the cap-weighted sector ETFs, and the bottom panel shows the same ratio using equal-weighted sector ETFs. Both of these ratios made a major peak in Q1 2025, and both of them trended lower into a mid-April low. Over the last three weeks, we’ve seen a dramatic upside reversal in these offense-defense rations, indicating a rotation from defensive to offensive positioning.
Quite simply, I don’t see the major averages pushing higher unless these ratios continue to gain ground to the upside. We have observed strength in some Consumer Staples names, from Kroger (KR) to Coca Cola (KO), but it would take charts like Amazon (AMZN) making a significant move higher to give the S&P 500 any real chance of pushing above its own 200-day moving average. This ratio moving higher would confirm that “things you want” are outperforming “things you need”, and that has bullish implications for risk assets.
Investors are facing more uncertainty than ever as we brace for the latest Fed announcement, the newest tariff headline, and mixed results in the form of economic indicators. By watching charts like these, and keeping a watchful eye on the updated Market Summary page, StockCharts users can approach these markets with confidence.
RR#6,
Dave
PS- Ready to upgrade your investment process? Check out my free behavioral investing course!
David Keller, CMT
President and Chief Strategist
Sierra Alpha Research LLC
marketmisbehavior.com
Disclaimer: This blog is for educational purposes only and should not be construed as financial advice. The ideas and strategies should never be used without first assessing your own personal and financial situation, or without consulting a financial professional.
The author does not have a position in mentioned securities at the time of publication. Any opinions expressed herein are solely those of the author and do not in any way represent the views or opinions of any other person or entity.